Safe Streets AI Lab – Project Proposal Template
Safe Streets AI Lab – Indiranagar Pilot
An AI-Enabled Urban Safety, Walkability and Environmental Exposure Assessment Initiative
Proposed By: Nexus3P Foundation
Project Location: Indiranagar, Bengaluru, Karnataka
Project Duration: 6 Months
Project Budget: ₹9.50 Lakhs (Maximum ₹10 Lakhs)
Implementation Model: Pilot Demonstration Project
1. Executive Summary
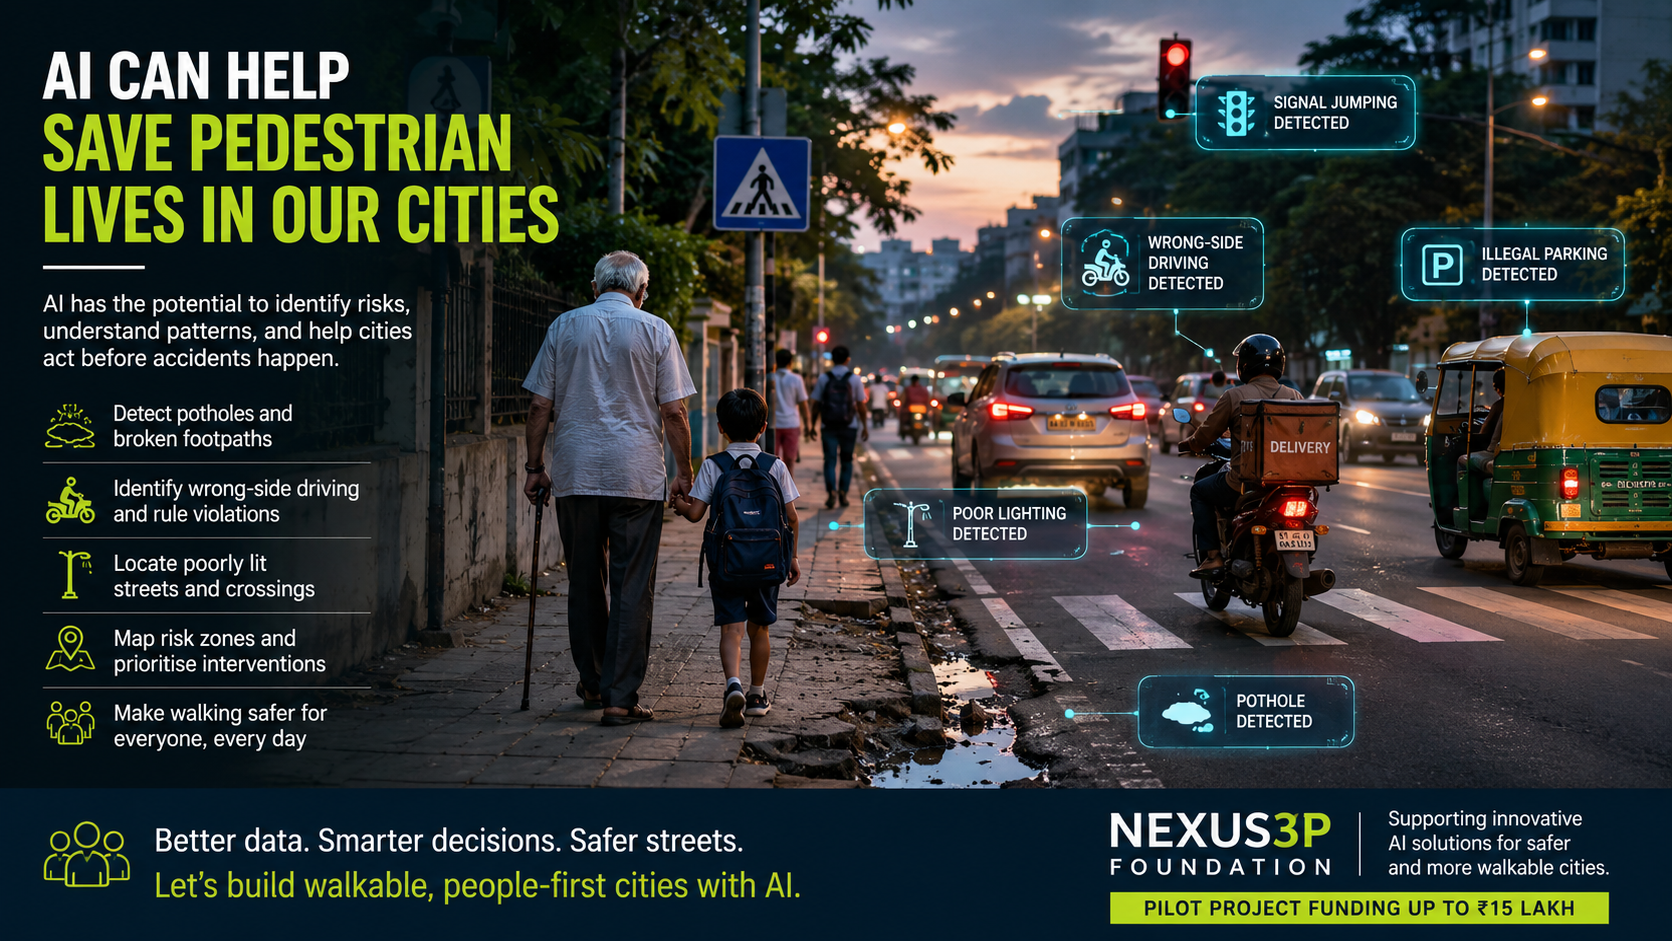
Indian cities have increasingly become vehicle-centric, often at the expense of pedestrian safety, accessibility, and quality of life. Even in premium urban neighbourhoods such as Indiranagar, pedestrians face multiple risks including damaged footpaths, potholes, poorly lit streets, encroachments, unsafe crossings, wrong-side driving, speeding two-wheelers, delivery riders using footpaths, signal violations, excessive noise, and deteriorating public spaces.
The Safe Streets AI Lab seeks to demonstrate how affordable digital technologies, artificial intelligence, citizen science, and community participation can generate actionable intelligence for improving pedestrian safety and urban livability.
The pilot will create a replicable framework that can subsequently be scaled to other parts of Bengaluru and other Indian cities.
2. Project Rationale
Current urban planning decisions are often based on fragmented complaints and limited data.
As a result:
- Hazardous locations remain unidentified.
- Pedestrian concerns remain under-reported.
- Senior citizen mobility challenges remain invisible.
- Urban environmental stressors are rarely measured together.
- Municipal agencies lack prioritised intervention maps.
The project seeks to bridge this gap through evidence-based, technology-enabled urban diagnostics.
3. Project Objectives
Primary Objective
To create an AI-enabled, citizen-driven model for identifying, analysing, and mitigating pedestrian safety and environmental risks in Indiranagar.
Secondary Objectives
- Map pedestrian infrastructure deficiencies.
- Assess walkability for vulnerable populations.
- Document behavioural traffic risks.
- Generate actionable municipal recommendations.
- Create community ownership of public spaces.
- Develop a scalable methodology for replication.
4. Geographic Scope
The pilot shall cover selected roads, intersections and public spaces within Indiranagar including:
- Residential streets
- Commercial corridors
- School zones
- Metro station influence areas
- Market areas
- Public parks and community spaces
Approximate coverage:
- 20–25 kilometres of streets
- 2–3 square kilometres of urban area
5. Target Beneficiaries
Direct Beneficiaries
- Pedestrians
- Senior citizens
- Women
- School children
- Persons with disabilities
- Cyclists
Indirect Beneficiaries
- Resident Welfare Associations
- Schools and colleges
- BBMP
- Bengaluru Traffic Police
- Urban planners
- Civic technology organisations
6. Scope of Services
Component A – Baseline Planning & Stakeholder Engagement
Activities
- Stakeholder mapping
- Identification of survey zones
- Engagement with RWAs
- Meetings with local authorities
- Development of field protocols
Deliverables
- Inception Report
- Stakeholder Register
- Detailed Implementation Plan
Duration: Month 1
Component B – AI-Based Urban Hazard Mapping
Activities
Collection of geo-tagged data relating to:
- Potholes
- Broken pavements
- Missing footpaths
- Open drains
- Obstructions
- Encroachments
- Poor lighting
- Unsafe crossings
- Traffic bottlenecks
Methodology
- Smartphone-based field surveys
- AI-assisted image classification
- GIS mapping
Deliverables
- Hazard Inventory Database
- GIS Hazard Layer
- Interactive Digital Maps
Duration: Months 1–3
Component C – Pedestrian Experience Assessment
Activities
Structured surveys among:
- Residents
- Students
- Senior citizens
- Domestic workers
- Delivery personnel
Survey Sample
Minimum 500 respondents
Deliverables
- Survey Dataset
- User Perception Analysis Report
Duration: Months 2–3
Component D – Senior Citizen Walkability Assessment
Activities
Assessment of:
- Footpath continuity
- Surface quality
- Crossing safety
- Street lighting
- Seating availability
- Shade and thermal comfort
Deliverables
- Senior Walkability Index
- Priority Intervention Map
Duration: Months 2–4
Component E – Traffic Behaviour Analytics
Activities
Deployment of temporary monitoring cameras at selected locations.
Analysis of:
- Wrong-side riding
- Riding on footpaths
- Signal violations
- Dangerous turning movements
Deliverables
- Traffic Behaviour Analytics Report
- Violation Heat Maps
Duration: Months 2–4
Component F – Urban Environmental Exposure Mapping
Activities
Measurement and documentation of:
- Noise exposure
- Air pollution hotspots
- Heat stress locations
- Poorly lit streets
Deliverables
- Environmental Exposure Atlas
- Exposure Risk Maps
Duration: Months 3–4
Component G – Citizen Science Program
Activities
Partnership with schools and colleges.
Students participate in:
- Street audits
- Environmental monitoring
- Hazard reporting
Deliverables
- Youth Participation Report
- Citizen Science Toolkit
Duration: Months 3–5
Component H – Public Dashboard & Knowledge Products
Activities
Creation of:
- Online dashboard
- Maps
- Visual summaries
Deliverables
- Public Dashboard
- Communication Materials
Duration: Months 4–5
Component I – Policy Engagement & Advocacy
Activities
Presentation of findings to:
- BBMP
- Traffic Police
- Ward Committees
- Resident Associations
Deliverables
- Safe Streets Report Card
- Policy Recommendations Report
- Stakeholder Workshop
Duration: Months 5–6
7. Project Deliverables
Technical Deliverables
- Inception Report
- Hazard Mapping Database
- GIS Street Safety Maps
- Pedestrian Survey Report
- Senior Citizen Walkability Index
- Traffic Behaviour Analytics Report
- Environmental Exposure Atlas
- Public Dashboard
- Safe Streets Report Card
- Final Project Report
Data Deliverables
- 5,000+ geo-tagged observations
- 500+ citizen surveys
- 25 km walkability assessment
- 20+ mapped risk hotspots
- AI-generated violation datasets
8. Project Timeline
| Activity | M1 | M2 | M3 | M4 | M5 | M6 |
| Inception & Planning | ● | |||||
| Hazard Mapping | ● | ● | ● | |||
| Citizen Surveys | ● | ● | ||||
| Walkability Audit | ● | ● | ● | |||
| Traffic Analytics | ● | ● | ● | |||
| Environmental Mapping | ● | ● | ||||
| Citizen Science | ● | ● | ● | |||
| Dashboard Development | ● | ● | ||||
| Reporting | ● | ● | ||||
| Dissemination | ● |
9. Milestones
Milestone 1 – Project Mobilisation
End of Month 1
Outputs:
- Inception Report approved
- Stakeholder consultations completed
Payment: 15%
Milestone 2 – Field Data Collection
End of Month 3
Outputs:
- Hazard mapping completed
- Citizen surveys completed
Payment: 30%
Milestone 3 – Analytics & Index Development
End of Month 4
Outputs:
- Walkability Index completed
- Traffic analytics completed
- Exposure mapping completed
Payment: 25%
Milestone 4 – Dashboard & Reporting
End of Month 5
Outputs:
- Dashboard operational
- Draft reports submitted
Payment: 15%
Milestone 5 – Final Dissemination
End of Month 6
Outputs:
- Final report submitted
- Stakeholder workshop conducted
Payment: 15%
10. Project Team
Core Team
Project Director
Overall oversight and stakeholder engagement
Project Manager
Day-to-day implementation
GIS & Data Specialist
Mapping and analytics
AI/Computer Vision Consultant
AI-based classification and analytics
Field Coordinator
Volunteer and survey management
Interns and Volunteers
Data collection and citizen engagement
11. Budget
| Budget Head | Amount (₹) |
| Project Management | 1,50,000 |
| Field Surveys & Data Collection | 1,20,000 |
| GIS Mapping & Analytics | 80,000 |
| AI & Computer Vision Analytics | 1,50,000 |
| Citizen Science Program | 1,00,000 |
| Dashboard Development | 75,000 |
| Workshops & Consultations | 75,000 |
| Communications & Design | 50,000 |
| Travel & Logistics | 50,000 |
| Contingency | 1,00,000 |
| Total | 9,50,000 |
12. Expected Outcomes
Short-Term Outcomes
- Evidence-based understanding of pedestrian risks.
- Improved civic awareness.
- Enhanced stakeholder collaboration.
- Prioritised intervention plans.
Medium-Term Outcomes
- Reduction in identified safety hazards.
- Increased pedestrian-friendly infrastructure investments.
- Improved urban governance decisions.
Long-Term Outcomes
- Replicable Safe Streets Framework.
- Expansion to other Bengaluru wards.
- Adoption by municipalities across India.
- Creation of a national Urban Environmental Exposure and Walkability Assessment model.
13. Sustainability & Scale-Up
The pilot is designed as a proof-of-concept.
Following successful implementation, the framework can be adapted for:
- Other Bengaluru wards
- Lucknow
- Delhi NCR
- Amritsar
- Hoshiarpur
- Smart Cities Mission locations
The project may also evolve into a recurring Urban Safety Index published annually by Nexus3P Foundation.