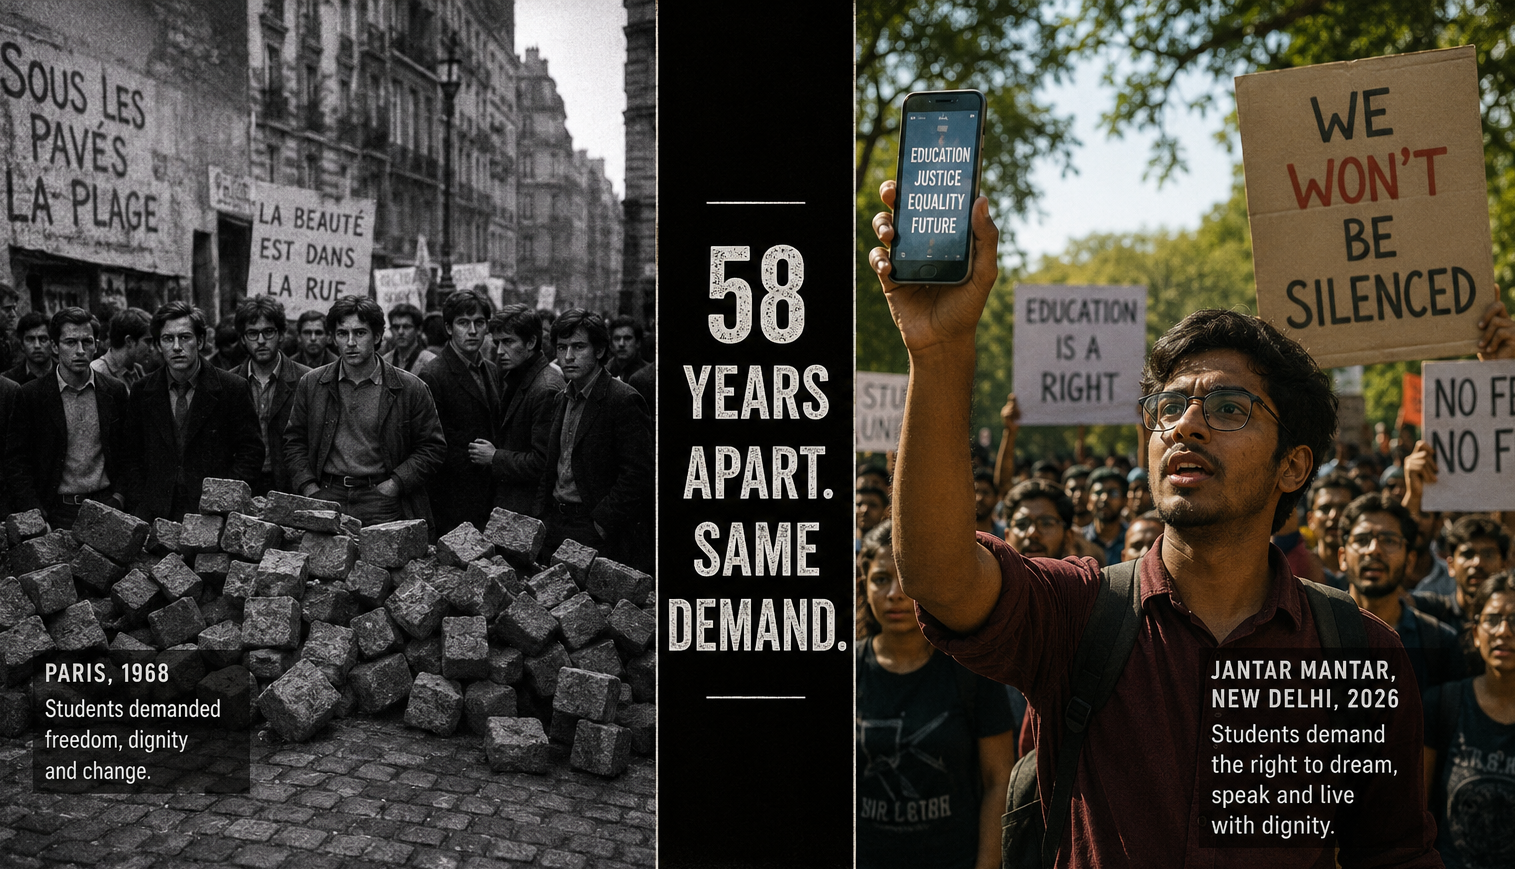
When Students Rise: From Paris 1968 to Delhi 2026, The Generation That Stopped Scrolling and Started Marching
A student’s future is not tied to a single city or a single year, it cuts across geography and time. When exams are stolen by leaks, an entire generation feels betrayed. These are not abstract grievances, they are immediate threats to livelihoods, dreams, and family sacrifices. Student movements can change public debate, shape policy, and shift political fortunes.
A Future Unlinked from Geography and Time
Students today are digital natives, they grow up with feeds and timelines, they learn from screens and social media. That shared experience creates a common language and a fast pathway to mobilize. A student in Paris in 1968 and a student in Delhi in 2026 may live decades and thousands of kilometres apart, yet both can respond to the same sense of injustice. When people feel their future is being stolen, they act.
Paris 1968, When the Feed Was Conversation in Cafes
The events of May 1968 began with students at the University of Paris protesting overcrowded classes and old curricula. The police responded with force, and the response hardened public opinion. Students built barricades in the Latin Quarter, and workers soon joined them. At the height of the unrest, around ten million workers were on strike. President Charles de Gaulle called snap elections, and he won. The immediate political challenge failed, but the movement changed French society, led to university reform, improved labor conditions, and reshaped culture.
Delhi 2026, When the Question Paper Became the Crime Scene
In 2026 millions of aspirants sat for the NEET-UG exam after years of study. Then allegations of paper leaks emerged. Students and families saw the exam as a social contract, a promise that merit would matter. When that promise broke, the response was immediate and furious. Protests sprang up in Delhi and other cities, and on social media the story spread within hours.
A youth collective that calls itself the Cockroach Janta Party, using satire and viral posts, helped spark the initial wave of outrage. The group grew fast, and its campaigns moved from the scroll to the street. Activists and civil society joined, public figures added voice, and the protests demanded accountability and systemic change.
From Scroll to Street, The Power of the Social Media Feed
The social media scroll is the motif of our time. It is how information moves, how outrage crystallizes, and how people coalesce into movements. In 2026 social platforms turned private frustration into public protest. Videos of police action, testimonials from affected families, and calls for solidarity circulated widely. The feed made the movement visible to millions within hours, and it held authorities accountable in real time.
Digital tools can amplify both truth and disinformation, they can mobilize support and they can invite co-option. The generation leading the protests knows how the scroll works, and they use it to set the narrative. That ability to shape the story outside established media channels gives the movement resilience.
How Student Movements Become Powerful
- A clear, visceral grievance that many people understand and feel
- A state response that risks appearing heavy handed, which can broaden sympathy for protesters
- A coalition beyond students, including workers, parents, teachers, and civil society
- Smart use of communication channels to control the narrative, especially social media
- Avoiding visible political capture, so the movement keeps its moral authority
Parallels Between Paris 1968 and Delhi 2026
Both movements started from specific, legitimate complaints that touched larger social issues. Both saw state actions that intensified protest. Both grew when other groups joined, and both forced national conversations about fairness, opportunity, and power. The big difference is the speed of communication. In 1968 ideas traveled through gatherings and newspapers, in 2026 the scroll spreads testimony instantly, and that changes how quickly a local grievance becomes national.
The Risk of Political Co-option
A constant danger for student movements is being seen as tools of political parties. When that happens, public sympathy erodes and the movement loses leverage. In 1968, attempts at co-option complicated the students efforts. In Delhi 2026, opposition parties have voiced support for protesters. That can be helpful in pressuring authorities, but if the movement appears controlled by party actors, it may lose the independence that gives it moral weight.
What the Government Must Understand
Governments facing student protests should not treat them as only a law and order issue, they should treat them as a demand for legitimacy. Quick fixes that punish individuals after the fact do not restore lost years. Fast track courts and stricter laws matter, but students want restoration of trust in the examination system and accountability that feels real. Heavy handed responses can turn a contained protest into a widespread political challenge.
What the Movement Needs to Protect
To keep moral authority the movement should maintain independence from formal party control, be transparent about demands and methods, and build broad coalitions that include families, teachers, and non partisan civic groups. The movement should also document events carefully, so evidence of wrongdoing or of excessive force is available to courts and to the public.
The Stakes for India
India has the largest youth population in the world, and exams are a main pathway to secure professional careers. When that pathway looks corrupt, faith in meritocracy erodes. The damage is not limited to one cohort, it can affect trust in institutions for years. Restoring trust requires open investigation, visible accountability, and structural reforms to examination systems.
Conclusion, From Scroll to Street
Student anger is not a passing trend, it is a response to broken promises. The social media scroll made a generation visible, and that visibility turned private outrage into collective action. From Paris 1968 to Delhi 2026 the lesson is clear, movements that start with a real grievance and remain independent have the power to change the public agenda. Governments should listen, respond with transparency, and restore trust. The generation that stopped scrolling and started marching is asking for fairness, they deserve a serious answer.
#StopScrollingStartMarching #TheScrollingGeneration #StudentRise #CJPProtest #CockroachJantaParty #NEETPaperLeak2026